
📚Educación
What is Fibonacci Retracement? #3 Key Points to OperateFibonacci recession, associated to the succession of the same name, is a principle applied in the technical analysis of Forex and other markets. In this article you we will talk about what Fibonacci recession is and how can you use it to do trading.
Contenidos
Discovery of the Fibonacci series
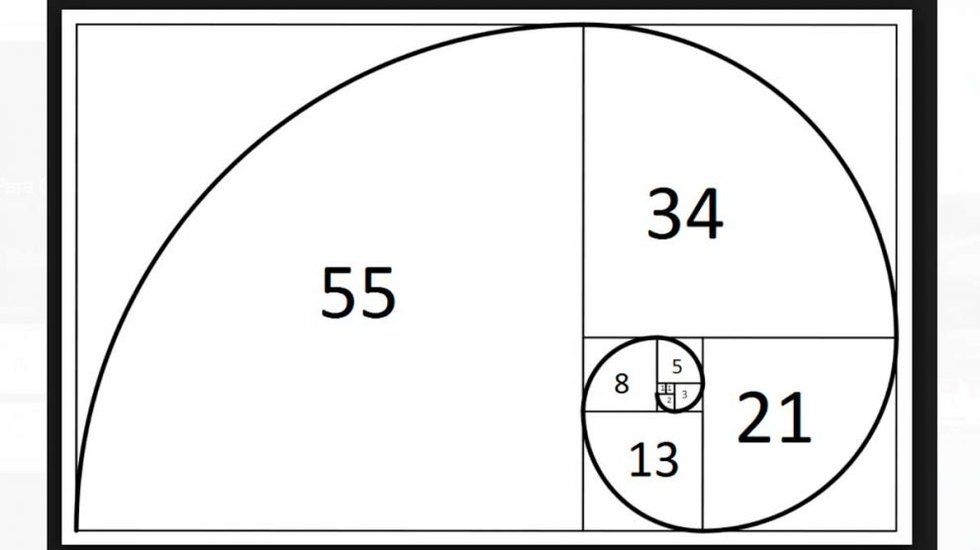
The Fibonacci series or succession is attributed to the Italian mathematician Leonardo de Pisa. It currently has numerous applications to understand and explain the behavior of variables in the most diverse branches of human knowledge, from mathematics, game theory, computer science, natural sciences and even finance, as we will see.
As it is known, the Fibonacci sequence or series begins with the numbers 0, 1 and then, from this, each term of the sequence is formed by adding the two preceding ones: 0 + 1 = 1, 1 + 1 = 2, 1 + 2 = 3, 2 + 3 = 5, 3 + 5 = 8, 5 + 8 = 13 … The elements of this sequence are commonly called Fibonacci numbers.
Fibonacci in Trading
In the case of finance, since Charles Henry Dow delivered the idea that prices move in trends, it is trying to understand them applying various principles for their study and analysis. Among these principles we can mention, as we said, Fibonacci recession.
The issue is that trends demonstrate behavior characterized by setbacks and rebounds, ups and downs. However, trends do not always appear the same or remain at a homogeneous speed. It is apparently erratic, although not as much as it seems to the naked eye.

Recession Behavior
Then, Fibonacci recessions refer to the fact the value of an asset that is on the rise, may recede to some extent, before continuing to rise. It is possible to construct a trend line by studying the extreme points of the upward and downward movement, observing the vertical behavior of the percentages.
Put more clearly: if you study the graph of the rise of any value, we will see that there are relative minimum points and relative maximum points, within it. So that is: the value began the rise (relative minimum point) came at a point where the upward momentum (relative maximum point) stopped and the downward correction began.
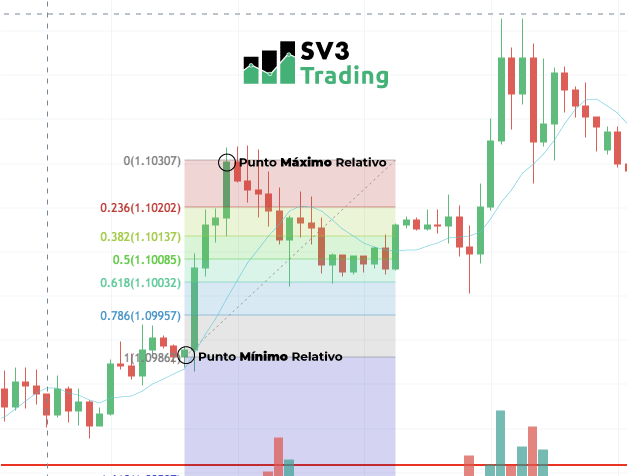
Now, if we draw a Fibonacci line, from each of the minimum points to the corresponding relative maximum, we can observe in many cases the price up to 38.2%, and then down to 61.8%.
tip
“”If you do not execute all the signals of the trading system, do not expect to get the results of the system” (P.Kaufman)
Why exactly these values and what do they have to do with Fibonacci? Easy: in the Fibonacci series, the proportion between each number and the next one is close to 61.8% (eg 13/21); the proportion between each number and the one that follows the next one is 38.2% (eg 13/34).
A weak trend may have a 38.2% retracement before rising again, while a strong trend may retreat even up to 61.8%, before resuming the rise.
Thus, in the event of a reversal in the price, it is required to calculate the probable magnitude of the recession movement, to predict the possible rise.
For this, the percentages obtained from Fibonacci, applied to the total magnitude of the previous trend; with the exception that these percentages can be determined only when it has been confirmed that the trend stops. That is, there is a change and the rise is transformed into low or vice versa but not while it is in force.
How to know if it is convenient to buy at a low
price, because the value will rise again?
In other words: How are we sure it will go up and not go down? How can we take advantage of the opportunities with this, to implement a strategy and make a profit?
The answer is not simple. You have to contextualize, studying each position within the trend.
Suppose we are facing an upward trend intact. That is to say, the rise has remained constant, without any fall. After a first correction has been made, a first minimum and a first maximum has been reached. A bull market extension can follow, which will confirm the continuation of the trend. This case could be a good sign to operate on purchase. Of course, you have to take into account other factors such as moving averages, patterns, volume, trend lines … etc,
It should be verified if this next correction reaches the area of the setbacks, that is, if it reaches 38.2%, 50% or 61.8%. If it does not reach 38.2% and the price rises before going down to that level, this correction must be passed. But if at least the level of 38.2% is reached and the price starts to bounce, this could define an entry point (looking at many other things to confirm).
Of course, at this point there may be several rebounds and more setbacks, and even reach the price a lower level than it was when we entered; but this also happens before a new bull market momentum is created.
Be careful of false operations, attentive to the following points:
– The correction begins when the price falls from a relative maximum and arrives at
less to the Fibonacci recession line of 38.2%.
– If the price after the correction is above the maximum, that correction ends and follows the trend.
– Below the 61.8% line, the trend can break (signal to trade short).
In summary, the market is on the rise intact. There is a decline of at least 38.1%, after this decline, it would be likely an extension confirming the trend.
In the best case, you should always enter the operation when generating the extension in the decline. It is not one hundred percent infallible, this is only a possible input signal. We will have to do more analysis to increase the chances that the signal will succeed.
Finally, we must know where to put the SL, there are traders that put a limit of possible fixed losses, and others that adjust the Stop Loss according to the market structure.
In future articles we will explain how to place the Stop Loss and content on trading totally free.
📲 Join Our Telegram Channel
📚 Follow our Tips on Instagram @sv3trading.uk.usa
📩 If you have any questions, please contact the Web Chat or Email
